


IT overview: servers, locations, security baseline and storage
17 views · by Kevin J Bruno · updated 1 day ago
The IT overview is the home page of the IT toolkit. On one screen it shows how your firm's servers are doing, how the free security baseline stands, how much storage the firm uses and where it goes, how much space each person takes up, and each project's size and activity. It is the page to open first thing in the morning, or whenever someone says "the portal feels slow" or "are we running out of space?".
The IT overview is the first tab of the IT hub. The other tabs hold the rest of the IT toolkit, including the Firewall tab, your firewall dashboard: what the BIMeta firewall blocked on your portal, who is banned, your allow list and the emergency lockdown (see Firewall: see what's blocked, ban addresses and lock down your portal).
The page only ever shows sizes and counts. It never shows file names or file contents, so people's personal files stay private here too.
Where to find it
- Sidebar → Admin → IT, then the Overview tab. The IT entry opens on the Overview tab; a row of tabs across the top of every IT page (Overview, Accounts, Alerts, Devices, Licences, Security, Firewall, Your encryption key, Directory sync, Connection check, Maintenance, Restore files, Retention and holds, Storage cleanup, Report, Audit export) takes you between the IT tools. If the window is narrow, scroll the tab row sideways to reach the last tabs.
- Press Ctrl K (Jump to…) and type
it overview. - The IT overview link at the top of the Accounts tab, and the links back to it on Security, Maintenance and Storage cleanup.
Who can use it
- Business Owner and IT Staff can open the page. Both see exactly the same thing; there is nothing to change on this page, it is for looking. Both also see every tab of the IT hub. (Someone given only part of the IT permissions in a custom role sees only the tabs they may use; for example, Restore files needs permission to manage storage, and Security, Your encryption key, Directory sync and Audit export need permission to manage IT security.)
- Admin, BIM Manager, Project Manager, Human Resources and User can't open it. The IT toolkit is kept separate from general firm settings on purpose, so even Admins don't get it unless they also hold the IT Staff role.
The page
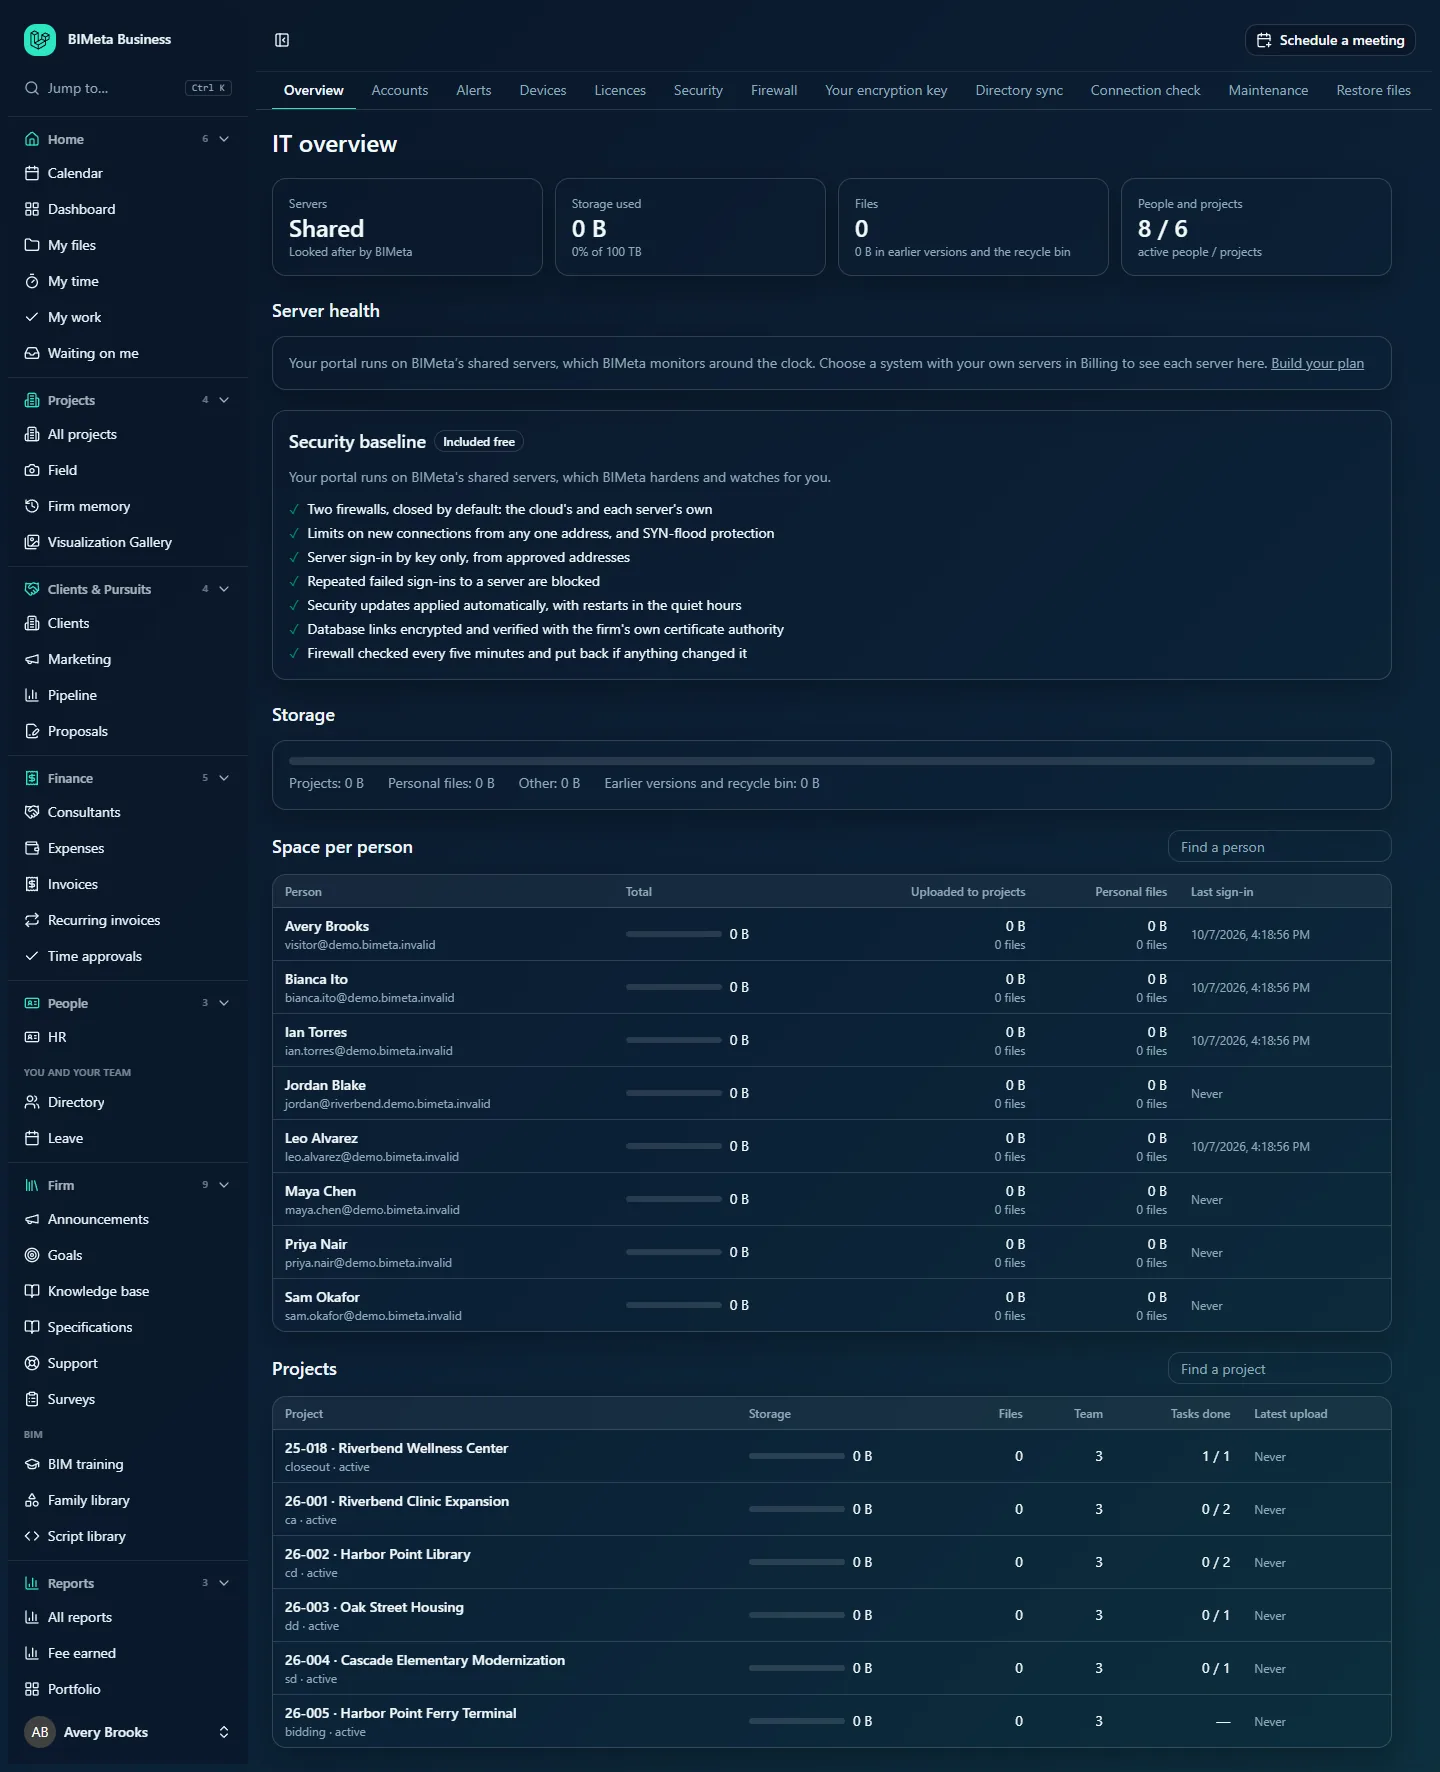
Here is the IT overview for the example firm Northlight Architects, which runs on BIMeta's shared servers:
The four summary cards
- Servers: if your firm has its own servers, the number of servers and a line such as "5 healthy · 1 need a look". If your portal runs on BIMeta's shared servers, the card says Shared and Looked after by BIMeta.
- Storage used: the total space your files take, including earlier versions and the recycle bin, and the share of your storage allowance, for example "0 B · 0% of 100 TB". If no limit is set it says No storage limit set.
- Files: how many current files the firm has, and how much space is taken by earlier versions and the recycle bin (space you can win back on Storage cleanup).
- People and projects: active people / projects, for example "8 / 6".
Locations and routing
This section appears only when your portal is served from two or more locations (for example a main location and a second region). On a single location or on BIMeta's shared servers it isn't shown, as in the screenshot above. It tells you, in one sentence, how people are sent to your locations:
- "Everyone uses the main location; if it stops answering, people move to the healthiest other one." (failover)
- "Everyone uses the main location; offices can use their own addresses." (pinned)
- "Each person is sent to the closest healthy location." (nearest)
- "Visits are shared between the locations by weight." (weighted)
After the description you may see Serving now: with the location currently in use (for failover and pinned routing), and Routed by with the routing service in use. Below it, one chip per location with a green dot (healthy) or a red dot (not answering); the main location is marked main. If people were moved to another location recently, Last moved: shows when. Routing is set up and changed by BIMeta; this section is for checking it at a glance. To change how your locations share the traffic, contact BIMeta support.
Server health
On BIMeta's shared servers you see a note that BIMeta monitors them around the clock, and a Build your plan link to Billing if you'd like servers of your own.
If your firm has its own servers, there is one table per location (the main location first, marked Main location). The heading shows the location's name, the cloud provider and the place. Each row is one server:
| Column | What it shows |
|---|---|
| Server | The server's job and number, such as Web 1, Database 1, Database copy 1, Cache 1, Worker 2 or Everything 1 (one server doing all jobs). Underneath: its size, vCPUs, memory and disk. An added badge marks a server you added on top of your plan. |
| Status | Healthy; Busy or needs a look (CPU, memory or disk at 90% or more, or the database check failed); Not reporting (no report for 15 minutes); or Setting up. Below the status: how many people are online and how many background jobs are waiting. |
| CPU, Memory, Disk | A small meter with the latest percentage: green below 75%, amber from 75%, red from 90%. |
| Last report | When the server last reported in. Servers report every five minutes. |
| History | Opens a chart of CPU, memory and disk for that server. Switch between 24 hours, 7 days and 14 days. Click Hide history to close it. |
Security baseline
Marked Included free. Every server BIMeta builds is hardened and watched at no charge. The list shows each protection with a mark:
- Two firewalls, closed by default: the cloud's and each server's own
- Limits on new connections from any one address, and SYN-flood protection
- Server sign-in by key only, from approved addresses
- Repeated failed sign-ins to a server are blocked
- Security updates applied automatically, with restarts in the quiet hours
- Database links encrypted and verified with the firm's own certificate authority
- Firewall checked every five minutes and put back if anything changed it
A ✓ means it's in place. On your own servers, … with "(waiting for the servers to report)" means not every server has reported in the last 24 hours, and a red ✕ with "(BIMeta has been alerted)" means a server reported a problem; BIMeta is already looking at it. If any server is currently blocking addresses after repeated failed sign-ins, a line underneath says how many.
Storage
A bar showing how full your allowance is (it turns red at 90%), and a breakdown: Projects, Personal files, Other (files that belong to neither, such as firm libraries), and Earlier versions and recycle bin. Earlier versions and binned files still count toward your storage until they expire or are cleaned up.
Space per person
Everyone in the firm, biggest first. Type in Find a person to filter by name or email.
- Person: name and email. A badge such as invited or inactive appears if the account isn't active.
- Total: a bar and total size (project uploads plus personal files).
- Uploaded to projects: size and number of files this person uploaded to projects and other shared places.
- Personal files: size and number of their personal files (never names or contents).
- Last sign-in: date and time, or Never.
Projects
Every project, biggest first. Type in Find a project to filter by number or name. Click a project to open it.
- Project: number and name (e.g. 26-001 · Riverbend Clinic Expansion), with the phase and status underneath.
- Storage: a bar and the size of the project's current files.
- Files: number of current files.
- Team: number of project members.
- Tasks done: done / total tasks, e.g. 1 / 1, or — if the project has no tasks.
- Latest upload: when a file was last added, or Never.
How to check a slow or struggling server
- Open Admin → IT (the Overview tab) and look at Server health.
- Find any server not marked Healthy. Check which meter is high.
- Click History on that server and switch to 7 days to see whether it's a spike or a trend.
- If a server is always busy, consider a bigger size or an extra server in Billing. If it's Not reporting, BIMeta is alerted automatically; you can also set up your own alerts on the Alerts tab.
How to find out what's using storage
- Compare Projects, Personal files and Earlier versions and recycle bin in the Storage section.
- Look at the top of Space per person and Projects; both are sorted biggest first.
- To actually free space, go to Storage cleanup, where you can see the largest files, duplicates and earlier versions.
Tips and good to know
- The page is a snapshot taken when you open it. Reload it to refresh the numbers.
- People with Last sign-in: Never or a very old date are worth checking on IT accounts (Dormant accounts).
- Server health and the security baseline only list servers when your firm has its own servers. On shared servers, BIMeta does this monitoring for you.
- You'll get emails or Teams/Slack messages about server problems only if you turn on health alerts on the Security tab and choose who receives them on the Alerts tab.
- Attacks on your portal don't show on this page. The BIMeta firewall blocks them on its own; the Firewall tab shows what it blocked, and IT is alerted when blocked requests pass the level you choose there (the Firewall kind on the Alerts tab decides who hears about it).
- The Security baseline list is about the servers themselves (their own firewalls and sign-in). The BIMeta firewall that checks every web request to your portal is described on the Firewall tab and applies on shared servers and your own servers alike.
Troubleshooting
Why does Server health say my portal runs on shared servers?
Your plan doesn't include servers of your own. BIMeta watches the shared servers for you. To get your own servers (and see them here), use Build your plan in Billing.
A server shows "Not reporting". Is the portal down?
Not necessarily. It means BIMeta hasn't received a health report from that server for 15 minutes. If people can still work, the reporting may simply be delayed. BIMeta is alerted either way.
Why don't the per-person totals add up to Storage used?
Storage used also includes earlier versions, the recycle bin and files not uploaded by a particular person, while the per-person table counts only current project uploads and personal files.
Was this article helpful?
Share